Canada Post finds itself on a burning platform, a decades-old business model engulfed by digital disruption and financial losses. What went wrong, and how can data-driven analysis guide its revival? Let’s explore Canada Post’s spiraling numbers, the role of data and optimization in its turnaround, and why business analytics is critical to balancing public service sustainability with financial reality.
Declining Mail and Rising Costs
Data doesn’t lie, Canada Post’s core business of letter mail has collapsed in the digital age. At its peak in 2006, Canada Post delivered about 5.5 billion letters; by 2024[1], that fell to just 2.0 billion, a 63% plunge in volume. Canadian households used to receive an average of seven letters per week in 2006; today it’s only about two. This dramatic drop is the direct result of emails, online billing, and digital communications replacing traditional mail.
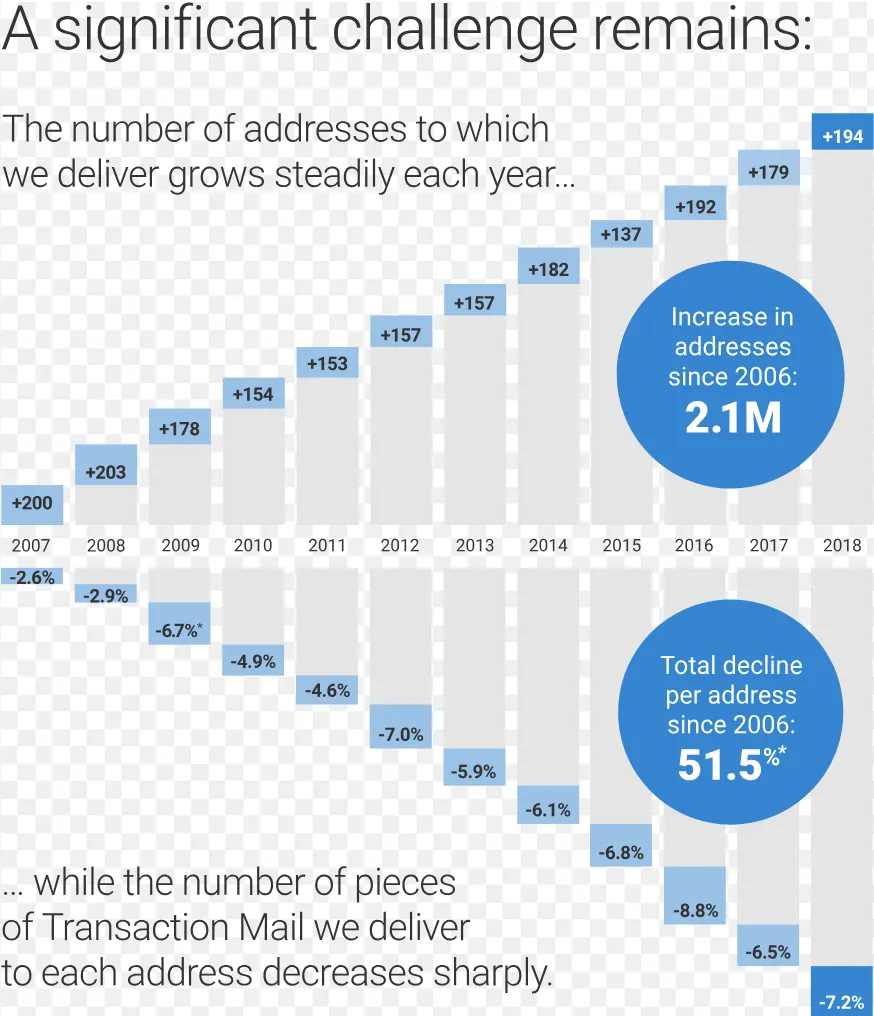
Letter mail volumes have plummeted from 5.5 billion pieces in 2006 to about 2 billion in 2024, a trend evident in Canada Post’s data[1]. Meanwhile, the number of addresses served keeps rising, amplifying the cost per letter delivered.
Compounding the problem, the number of addresses Canada Post must serve keeps growing every year. In 2006, there were 14.3 million addresses. By 2024 that expanded to 17.6 million, roughly 3.3 million more delivery points. The population has grown by nearly one-third since 2006, meaning Canada Post is obligated to visit more homes and businesses than ever, even as there’s less mail for each to receive. As Canada Post itself starkly put it, “a system built to deliver 5.5 billion letters a year cannot be sustained on two billion letters”. The result, rising per-unit costs.
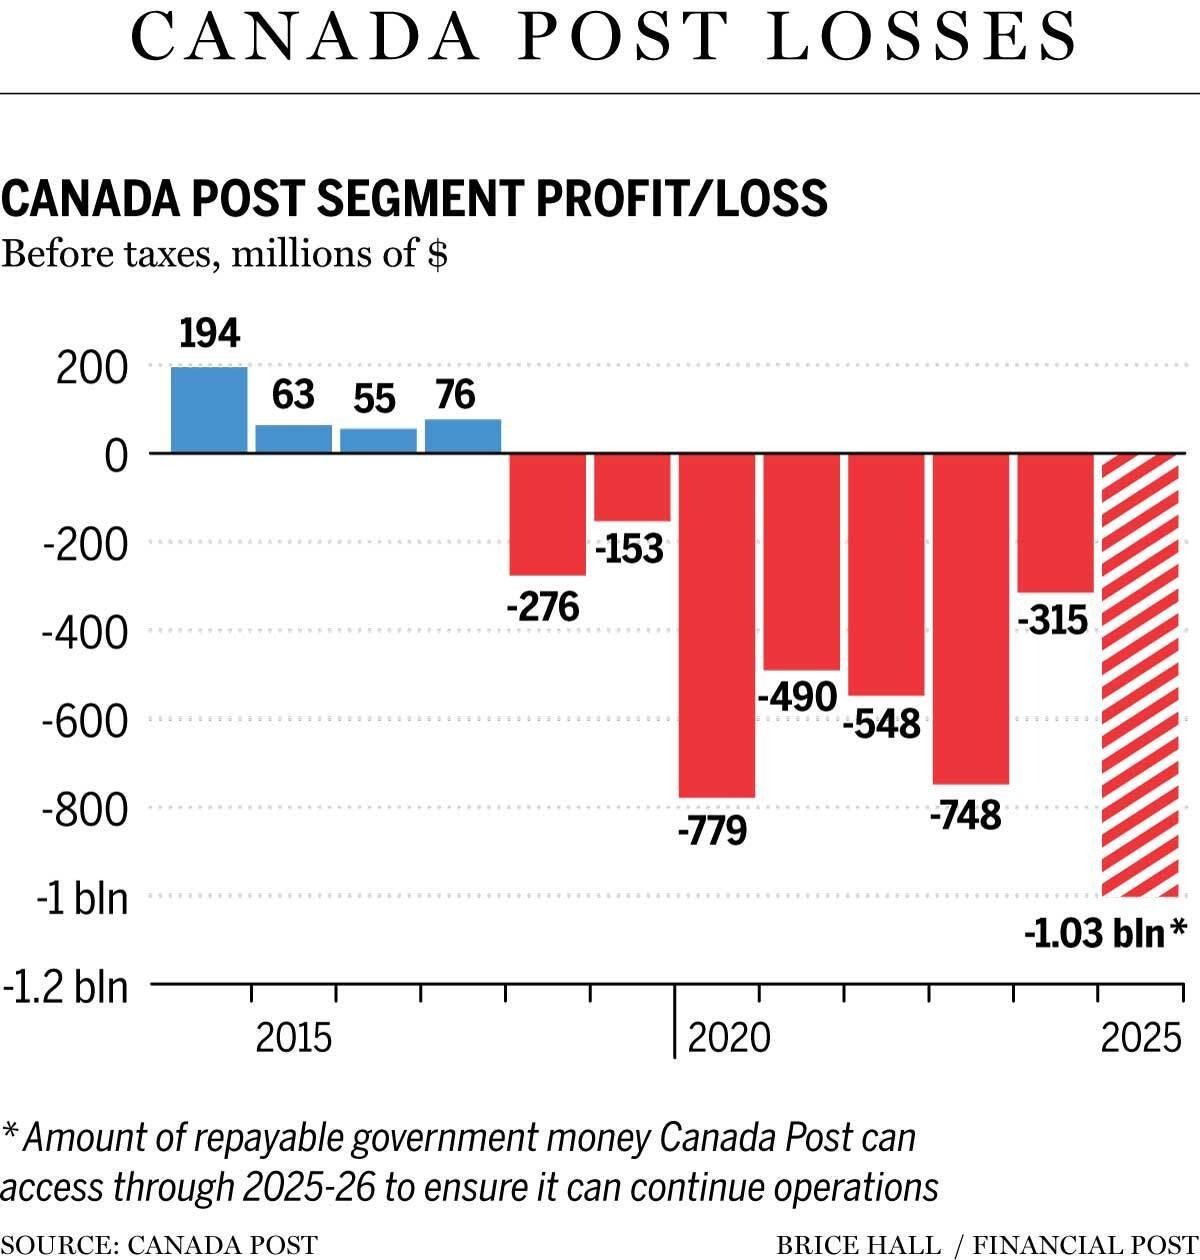
Financial data paints the same bleak picture. Between 2018 and 2025, Canada Post accumulated over $5 billion in operating losses. In 2024 it lost more than $1 billion, and 2025 is on track to lose around $1.5 billion[3]. By mid-2025 the situation was so bad that the government had to inject $1 billion just to keep the company solvent[3]. As of the second quarter of 2025, Canada Post was bleeding about $10 million in losses every single day[3]. These staggering figures highlight an existential crisis. It’s no wonder a government commission bluntly concluded that “Canada Post is facing an existential crisis. It is effectively insolvent, or bankrupt. Without immediate changes, its fiscal situation will continue to deteriorate”[2].
What’s driving these losses? A big factor is fixed obligations amid declining revenue. Canada Post has a mandate of universal service. By law it must deliver mail five days a week to every address in Canada, from urban condos to remote farms. This mandate is non-negotiable and costly. Maintaining a nationwide delivery network, regardless of volume, creates a high fixed-cost base. Postal workers still walk or drive every route, burn fuel, and wear and tear vehicles, even if they carry only a few letters. Labor and benefits alone made up 64.9% of Canada Post’s operating expenses in 2024[3], reflecting the manpower-intensive nature of door-to-door delivery. In fact, the corporation spends over $10 million per day on labour costs[1]. Such costs were easier to bear when each stop yielded a bundle of letters, but not when mailboxes are often empty.
Moreover, Canada Post has struggled to replace lost letter revenues with new business. Parcels from online shopping were once seen as the growth savior, but the data shows Canada Post has lost significant market share in parcel delivery too. In 2019, Canada Post handled 62% of all parcels in Canada Today its share has plunged below 24%[3]. Private couriers and in-house logistics now dominate e-commerce delivery. With parcel volumes plateauing or even declining for Canada Post[3], the hoped-for revenue boost from e-commerce hasn’t fully materialized. The bottom line is a classic case of a disrupted business model.
How Data Analysis Informs Strategy
If ever there were a time for data-driven decision making, it’s now. The identification of Canada Post’s problems itself came from careful data analysis of trends in mail volumes, delivery points, costs, and market share. The next step is using analytics to guide solutions. Here’s where business analytics and not just number crunching for its own sake comes into play.
One fundamental approach is to analyze operational efficiency metrics. For instance, Canada Post’s own analysis revealed that delivering mail to the door costs about double what delivery to community mailboxes would cost on a per-address basis. Converting addresses from door-to-door delivery to community mailboxes could save on the order of $300–$400 million per year in operating costs[3][4]. This kind of insight comes from combining delivery route data, time-and-motion studies, and cost analysis. Classic data analytics feeding directly into policy. It’s no surprise the federal government, armed with these numbers, recently lifted the moratorium on community mailboxes, allowing Canada Post to convert the remaining 4 million door-to-door addresses to centralized delivery[3]. The data shows that a letter carrier walking up to every doorstep is a costly luxury in the digital age and that clustering deliveries is far more efficient.

Similarly, analysis of transit times and logistics costs indicated that Canada Post was using expensive air transport for mail that didn’t need such speed. By rerouting non-urgent mail via ground transport, the postal service can relax its delivery standard from 2–4 days to 3–7 days for regular letters. This trade-off, backed by cost modeling, is projected to save over $20 million annually in transportation costs[3]. The key was identifying where service levels could be adjusted without greatly harming customers, slightly slower service for significant savings. A decision informed by analyzing delivery times, customer demand for speed, and cost per mode of transport.
Data analytics also plays a role in asset rationalization. Canada Post maintains thousands of post offices, many protected by a 30-year-old mandate that no rural post office be closed. Some rural post offices see very few customers especially if the surrounding area isn’t truly “rural” anymore but has other options like nearby postal outlets in pharmacies. By analyzing demographics, usage patterns, and proximity of alternative services, Canada Post can identify locations where consolidating or closing a post office makes sense. The government has green-lit this analytics-driven approach by lifting the moratorium on rural post office closures, tasking Canada Post with developing a plan to “modernize and right-size” its network[3]. In plain terms, use data to figure out which locations are underutilized and costly, and restructure accordingly.
Underneath all these examples is a common theme of using analytical tools to find an optimal balance. This is where techniques like linear programming and optimization come into play in a very practical way:
-
Network Optimization & Linear Programming: With delivery routes and post office locations under review, Canada Post can use linear programming models to determine the optimal way to service all addresses at minimum cost. This resembles classic Vehicle Routing Problems and facility location problems in operations research. For instance, an LP model could minimize total distance or hours spent delivering mail, subject to constraints that every address is served at least X times per week. By inputting data on address locations, road networks, and mail volumes, algorithms can propose more efficient routes for postal carriers or suggest which neighborhoods could shift from daily delivery to alternate-day delivery to save costs. These optimizations might involve complex integer programming since decisions like assigning whole routes to carriers or opening/closing facilities are discrete choices. But the core idea is the same, i.e. systematically search for the cost-minimizing way to meet service obligations. In a business as geographically sprawling as Canada Post, even single-digit percentage improvements from better routing can mean tens of millions saved.
-
Goal Programming for Multiple Objectives: Canada Post isn’t just trying to minimize cost but it must also consider service quality, jobs, and other goals. Goal programming is a variant of optimization that can handle multiple objectives. This ssentially allows trade-offs between competing goals. For example, one goal could be to minimize costs, while another goal is to minimize layoffs or maintain a certain service level to rural communities. Rather than an all-or-nothing approach, goal programming can seek a solution that satisfies cost reduction targets while also meeting service coverage benchmarks. In practice, Canada Post’s leadership will have to balance political and social goals against financial sustainability. Analytics can assist by quantifying those trade-offs. An example, for every $100 million saved, how much delivery frequency has to drop? or if we want no more than 5,000 job cuts, how else can we compensate in cost savings? By modeling these scenarios, data-driven negotiations can take place, hopefully finding a middle ground that preserves as much service as possible while still closing the financial gap.
-
Predictive Analytics and Forecasting: Another crucial role of data science here is forecasting and stress-testing. Analysts have projected that without changes, Canada Post’s losses would only deepen from $1 billion to $1.5 billion to perhaps $3 billion annually in a few years[3]. These projections come from predictive models that extrapolate current trends. Such models underscore the urgency for action. Additionally, forecasting can help in resource planning, predicting mail volumes, parcel volumes, or the adoption rate of e-statements. This can inform how much capacity Canada Post will need in its processing plants and transportation network. Accurate forecasts ensure that the optimization solutions we implement today remain valid tomorrow, rather than overshooting or undershooting the needed service levels. In short, you model the future before making irreversible cuts.
-
Data Visualization for Communication: Let’s not forget the simplest tool in analytics, a clear chart or map can drive the point home to stakeholders. Visuals along with maps of proposed route changes or heatmaps of underutilized post offices are powerful in communicating why changes are needed. Canada Post’s executives and the government have used these analyses to build the case for reform, both to the public and to their employees.
Business Analytics

While data and analytical models are essential, business analytics demands a broader perspective. It aligns data insights with the overall mission and sustainability of the organization. Canada Post’s dilemma isn’t just a math problem but a strategic challenge at the intersection of public service and commercial viability. Here, the distinction between data analytics and business analytics becomes important.
Data analytics might tell us “door-to-door delivery is too expensive” or “letter volumes are down 63%,” but business analytics asks What do we do about it, in light of our mission?. The answer isn’t always “cut more” or “maximize profit at all costs”. Business analytics involves incorporating stakeholder values, long-term strategy, and sometimes intangibles like brand trust or public good into the decision-making process, alongside the hard data. On one hand, the government views Canada Post’s situation in stark financial terms, an unsustainable operation that needs a turnaround. The measures announced aim to “ensure the survival of Canada Post and protect the services Canadians rely on”[3] by restoring financial stability. From this perspective, analytics success might be measured in dollars saved and losses stemmed.
On the other hand, postal workers and their union emphasize Canada Post’s role as a public service network. They argue that sustainability doesn’t have to mean profitability. Instead, the goal should be to break even while delivering value to Canadians. The union has bristled at deep cuts, calling them an “attack on public services”[4], and has even suggested expanding Canada Post’s services to generate revenue rather than just shrinking operations. For example, postal unions and some experts have proposed leveraging Canada Post’s vast network to offer new services like postal banking or community check-ins for seniors[4]. These ideas stem from analytics of a different sort. Market analysis and social data asking what other needs exist that this trusted national network could fulfill? A business analytics approach would evaluate such proposals not just by their immediate profit, but by how they align with Canada Post’s strengths and public value proposition.
This is a classic for-profit vs. for-service debate. A purely financial model might conclude that certain rural routes or doorstep deliveries should be eliminated to save money vs a broader model that might assign value to those services. How do you quantify the benefit of a mail carrier checking on an elderly resident as part of their rounds? Goal programming, as mentioned, could incorporate these dual objectives. Minimize financial loss and maximize community service value. In business analytics terms, one might perform a cost-benefit analysis that includes social benefits or a Balanced Scorecard approach that measures success across financial, customer, and community metrics.
Another example of business analytics is risk analysis and scenario planning. Canada Post must weigh the risks of its decisions. Cutting services may drive more customers away for good, as happened when a 32-day strike in late 2024 led many businesses to permanently shift to other delivery providers[1]. A holistic analysis would ask If we reduce service quality, will we enter a “death spiral” of accelerating volume decline?. Data science can attempt to model this. Business analytics takes those findings and formulates strategy. Perhaps that’s why the government speaks of “thoughtful, measured, staged” changes[2] to avoid sudden shocks that undermine the remaining customer base. In other words, analytics isn’t just about finding what to cut, but figuring out how to cut (or where to invest) in a way that the business can survive long-term.
Finally, it’s worth noting that Canada Post’s challenges are not unique, postal agencies worldwide face similar predicaments. The U.S. Postal Service, for instance, recorded a $9.5 billion net loss in fiscal 2024[4], thanks to the same decline in letter mail and hefty universal service costs. Many countries have had to reinvent their postal business models. This global context reinforces that data-driven adaptation is the only way forward. Business analytics encourages learning from these cases - “What worked elsewhere, and what do our local data and customer behaviors suggest might work here?”
Conclusion
Canada Post’s burning platform can be extinguished not by panic or purely political fixes, but by smart, analytics-informed action. The story outlined is one where data science and operations research play a starring role in diagnosing the problem and pointing to solutions. We’ve seen how descriptive analytics exposed the unsustainable trend of more addresses and fewer letters, predictive analytics warned of mounting future losses, and prescriptive analytics is helping chart a path to a leaner, more efficient postal service through measures like route restructuring and service standard changes.
Crucially, we’ve also emphasized that analytics must serve business (or public service) strategy, not the other way around. Canada Post cannot simply cut its way to prosperity, it must balance cost-cutting with its mandate to serve all Canadians. This is where data-driven scenario analysis and goal-oriented optimization become vital, helping leaders find that delicate equilibrium between sustaining an essential service and avoiding financial collapse. In the end, the goal is a “strong, affordable…delivery provider” that “delivers to every community”[2] without bleeding red ink. Achieving that will require tough decisions guided by solid data.
For professionals in data science, business analytics, or operations, the Canada Post Story is a case study in the power of analytics to inform high-stakes decisions. It reminds us that every dataset tells a story. In this case, one of an institution that must reinvent itself or perish. By combining technical analysis with strategic thinking, we ensure that our recommendations don’t just look good in a model, but also make sense for the business and the public it serves. That is the essence of business analytics: turning data insights into actionable strategies for sustainable success.